

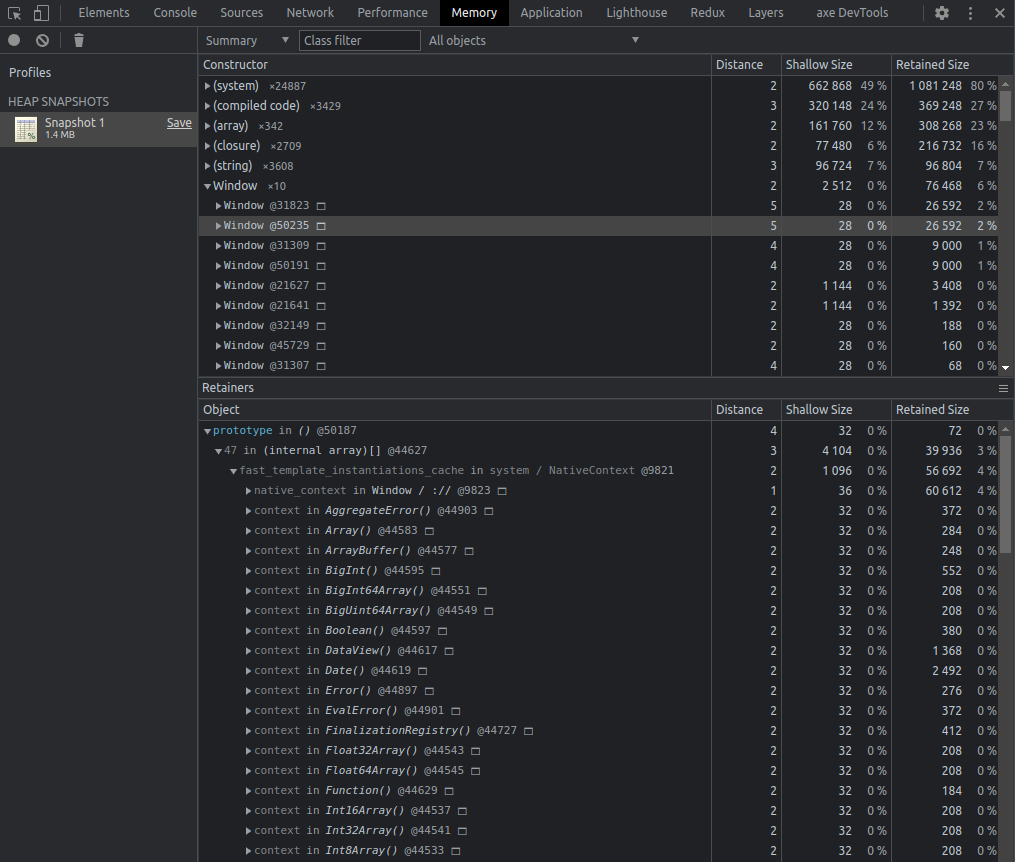
I got a chance to debug an app memory leak issue this week, when I took a heap snapshot in Chrome it dawned on me:
What the heck am I looking for?
Should I be sorting heap objects by distance, shallow size, or retained size?
JS Garbage Collection
JavsScript memory is managed automatically, meaning the JS engine's garbage collector releases heap memory automatically when they are no longer in use.
All modern web browsers (i.e. not IE) use some variation of the mark-and-sweep algorithm to determine which heap objects are safe for garbage collection (GC). The algorithm has two phases:
- Marking phase: Starting from a root object, recursively traverse all heap objects referenced by the root GC node and mark them as
in-use. - Sweeping phase: Iteratively visit all objects in the heap and release any that are not marked as
in-use.
This is a simplified description of the V8 GC process. In actuality, the Chrome GC keeps heap objects in multiple categories bucked by their generation and incrementally garbage collects them.
The distance column in the heap snapshot screenshot above indicates the reference distance between an object and the GC root. A memory leak occurs when an object that otherwise should be garbage collected is marked as in-use by the marking phase of the algorithm – meaning some other object is unintentionally holding its reference.
Setting up
The heap snapshot of a completely empty webpage still contains a significant amount of objects in its heap. So let's set up a test example to better monitor our heap usage using Chrome's built-in snapshot comparison function:
<html>
<head>
  <script>
    var memBuffer;
    function start() {
      memBuffer = {
          value: new ArrayBuffer(1000)
      };
    }
  </script>
</head>
<body>
  <button onclick="start()">start</button>
</body>
</html>
Note that we had to declare the memBuffer variable at the global scope to prevent the object from being garbage collected once the start function finishes execution. This is our memory leak into the global scope.
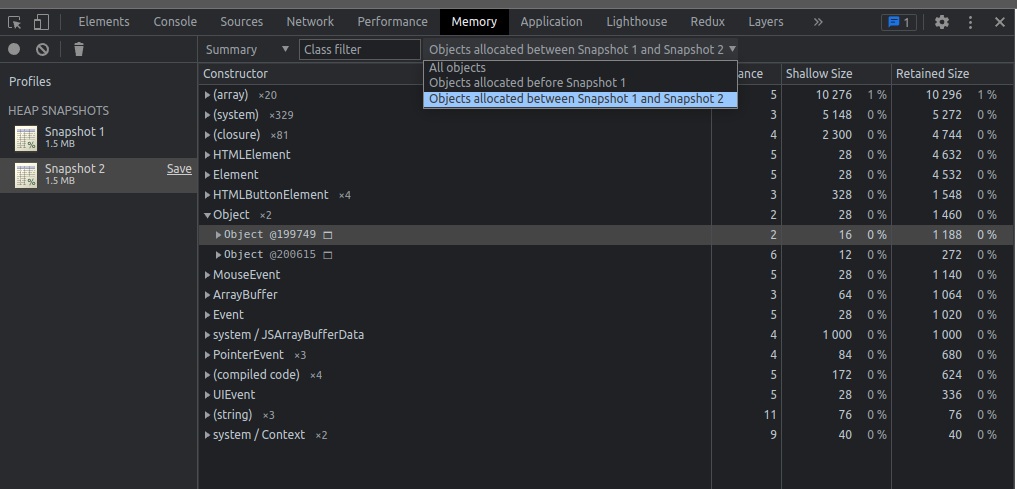
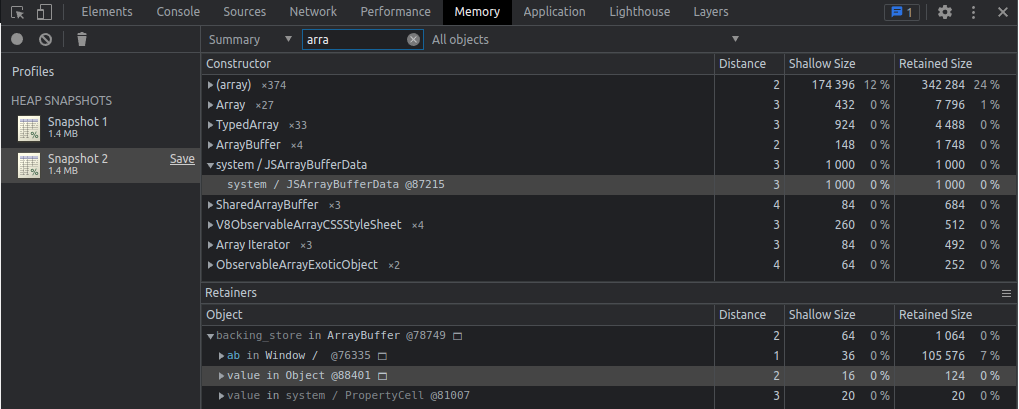
To use the snapshot comparison feature, we first take a snapshot of the page on page load, then click on the start button to allocate additional memory to our memBuffer object. We can then view new objects allocated between Snapshot 1 and 2 and filter for our new ArrayBuffer.
Shallow vs Retained Size
Once we've filtered for new JSArrayBufferData type heap objects, we see it has been added to the heap at 1kb for both shallow and retained sizes.
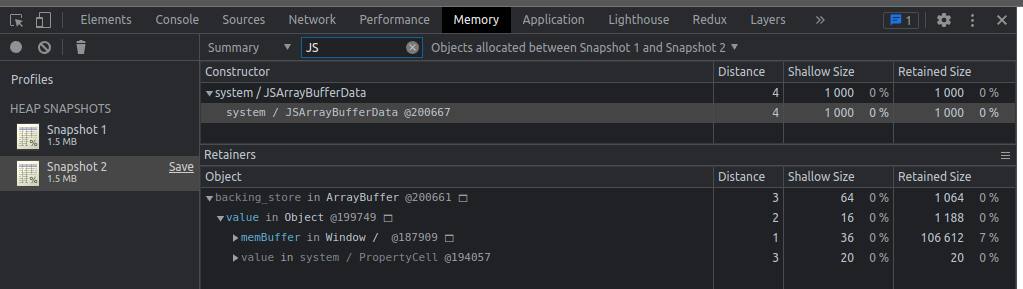
The retainer path provides us with details on the path that connects our buffer to the garbage collector root. GR root -> Window Object -> memBuffer object -> value key -> memory buffer for a total distance of 4. In Firefox, we can pull up the same information under the dominators view, although the exact object size and graph shape differ slightly due to implementation differences. FF also gives us a nice retaining path chart.
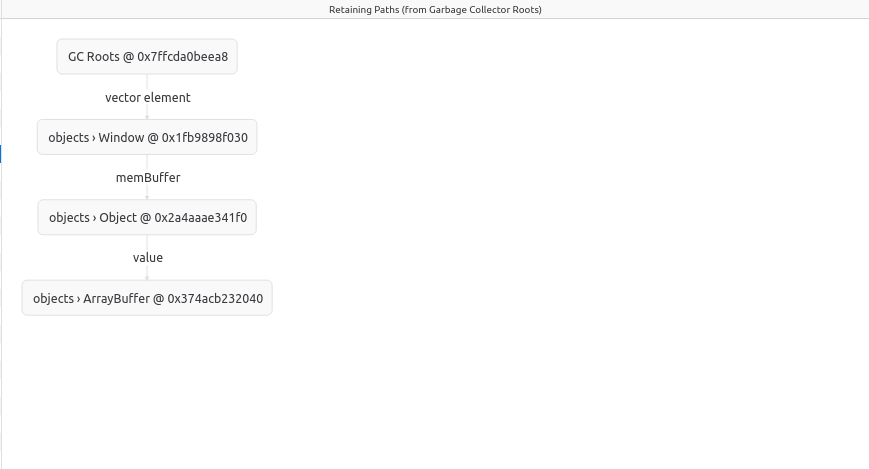
Going back to the value key in Chrome's retained size column, we see that 16b is the size of pointers used to keep track of key-value reference while the 1188b retained size includes the buffer object memory that will be freed when the value key is deleted.
In other words, we should look at the retained size column when looking at heap snapshots, it determines the amount of memory that will be released when an object is garbage collected.
To show the retained / shallow size difference, let's move our ArrayBuffer outside of the object instantiation and establish a global reference to it.
    var memBuffer;
    var ab =  new ArrayBuffer(1000);
    function start() {
      memBuffer = {
          value: ab
      };
    }
Running the test again, we see the value key's retained size has reduced from 1188b to only 124b. By adding another reference path to our ArrayByffer from GC root, the GC can no longer release the entire 1kb if our value key is deleted.
Going back to Firefox, we see an updated retaining path graph with the alternate path to our ArrayBuffer through the ab variable. Now there are two paths from the GC root to our ArrayBuffer.
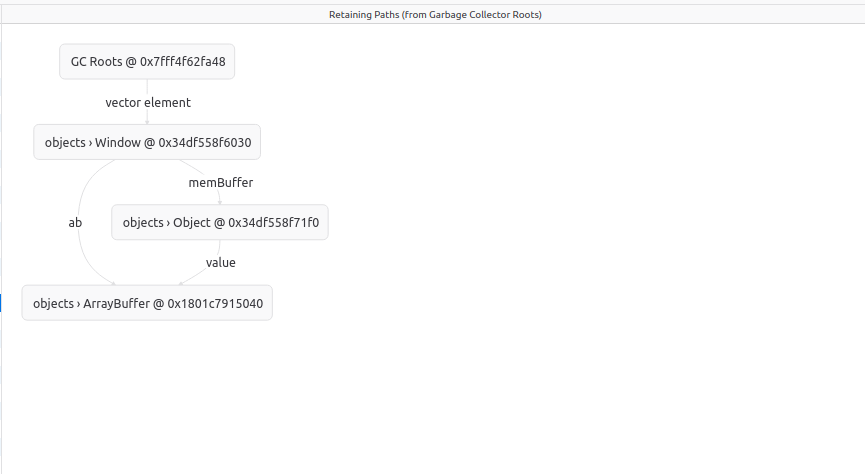
In graph theory terms, a node x is said to dominate another node y if every path from the root node to y must pass through x. The retainer size of a heap object is the size of all objects that it dominates. In the first example, the memBuffer object is a dominator for the ArrayBuffer while in the second example it is the Window object.
In summary, when troubleshooting memory issues:
- Use the snapshot comparison functionality to narrow your search down to newly created heap objects.
- Look for heap objects with a large retained size that should be garbage collected.
- To determine whether an object should be garbage collected, check its retainer path and examine reference validity.
- Some common memory leak issues are easy to resolve, if you see signs for detached elements, detached element event listeners, and large global cache objects, consider removing their dominator references.
I hope that was helpful! If you like the post, please share it with others. You may also be interested in learning about how to measure web performance with Navigation Timing API or how to use CSS custom properties to create style API. You can also subscribe to email updates using the form below.