
It seems like there's a new front-end tool every week to make our sites faster. Devs are asked to uglify, minify, inline, and compress our files as if Javascript insulted our collective mothers. A high-pitched voice in the back of my head sometimes wonders out loud "is the juice really worth the squeeze?".
Does switching to a a new compression algorithm actually provide performance savings or are we just shaving off a minuscule few milliseconds?
And if you believe web bundles should be as small as possible, how do you convince your manager and coworkers of its importance? Emulation mode of a modern browser in an office 2 miles away from a node on the internet backbone is a poor substitute for browsing your site in a rural area with unreliable satellite internet.
Or maybe, like me, you sometimes worry you'll be asked during a client/job interview to intelligently talk about how to improve web performance.
Fear not, we will explore the Navigation Timing Web API (Nav-Time API) in this post, a powerful tool to programmatically gather and measure some of your web application's key performance metrics. You can use these metrics to determine if your new toolchain was worth battling WebPack over, create performance measurement telemetry tools, or in order to impress an interviewer — I don't judge.
Navigation Timing Interface
First off, let's start with the two lines of JS to impress, hot off the press from the Navigation Timing Level 2 spec:
  const [entry] = performance.getEntriesByType("navigation");
  console.table(entry.toJSON());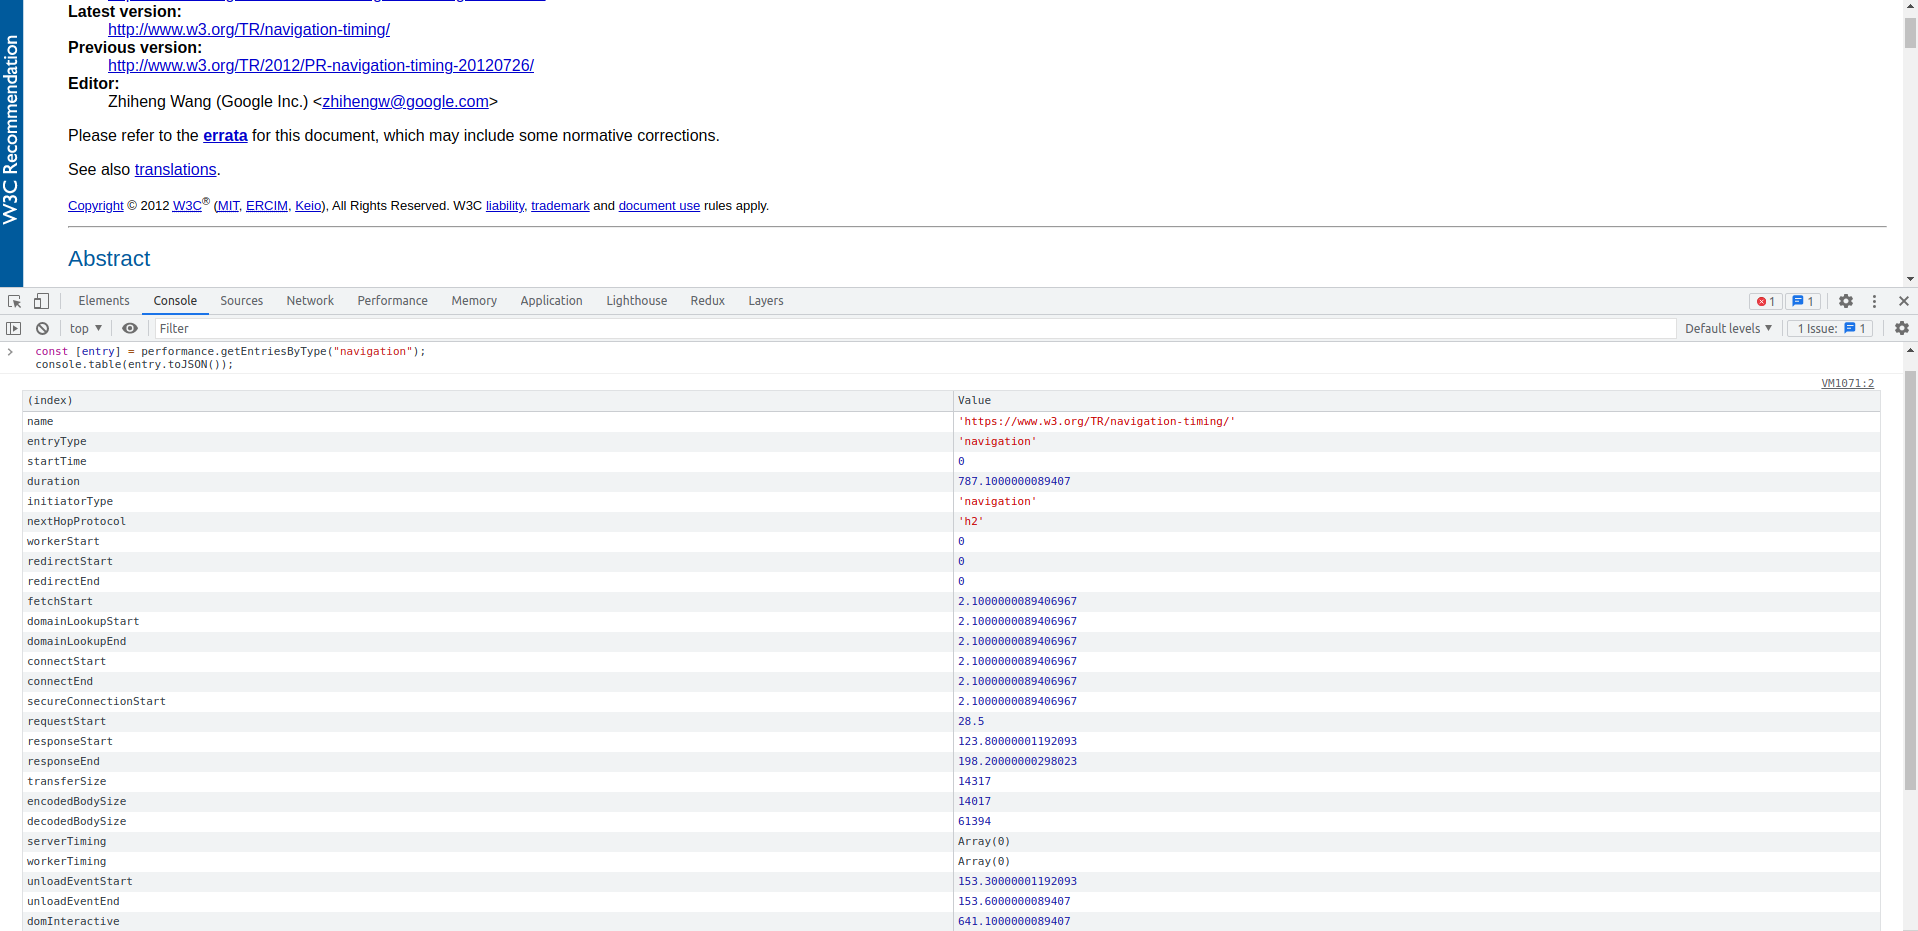
Look at these beautiful metrics!
The Nav Time API is a W3C recommendation designed specifically for measuring end-to-end user latency information. Version 1 has been around since 2012 and is supported in all major browsers, while level 2 is currently a working draft.
While it is possible to troubleshoot performance issues using your favorite browser's developer tools, before Nav-Time API it was not possible to do so programmtically. Naively, the JS runtime can only start after a part of the document is parsed would not have information about anything that happened before its instantiation.
Navigation Timing Overview
Let's take a look at the timing diagram from the spec to understand the scope of the API's navigational request. The start of the process is the moment you hit the enter key after typing in a new URL, and it ends at the completion of the 'load' event from the Window object, when all dependent resources such as additional stylesheets, images, and potentially async JS scripts are all fully loaded.

Here are some key metrics to look for when examining the performance timing results.
duration
This is your 5,000 feet performance indicator. Duration is the length of the entire request, snot to tail, in milliseconds. The strict definition of this duration is the difference between loadEventEnd (see below) and the startTime, which should be the time the browser starts a new navigation request (usually time zero).
Our overall goal is to make this duration as short as possible, although it's possible that we are interested in more granular times, see below.
responseEnd
ReponseEnd tells you how long it took to load the main page content, excluding various externally linked script files and stylesheets.
In a static HTML-only file, responseEnd is essentially the entire duration. It covers DNS lookup, TCP handshakes, and the time it takes for a server to serve the page content through a TCP connection. For modern web pages with external script files and stylesheet links, this is more of a 'server measurement' as it measures the time it takes for the user agent to find the server, along with any server processing time.
domInteractive
This is your time to DOM interactive (TTDI), which by its technical definition occurs when the browser stops parsing the document and sets its readiness to 'interactive'. This means the HTML DOM is no longer in strict parsing mode and the user can start to click on links and press keys to interact with the dom.
The TTDI is a great first pass indicator to measure page performance, the ability to click on a button usually indicates that a page is 'done loading'. However, CSSOM and blocking JS Scripts may still be rendering during this time. Note that there are some very interesting edge cases where the page may feel loaded to the user but domInteractive has not yet fired. Examples of this include when there's blocking JS at the bottom of a body tag or when font files are not loaded. To learn more about these edge cases, visit Utkarsh Goel's great domInteractive Post on Akamai's Blog.
domContentLoadedEventEnd
As the name suggests, the domContentLoaded event fires after domInteractive and indicates that additional content has been loaded. The 'content' in this context are JS blocking stylesheets and any parser blocking javascript files (i.e. non async or 'non-blocking') along with their execution.
domContentLoaded is a great metric to use if want to measure when all of a page's loading-related timing is complete.
domComplete
The domComplete timestamp is the 'ready ready' flag for a page, all the Javascript you want to run is complete, any Web Components you have are all amounted, and all your async scripts are fully executed.
Even though we technically still have another chunk of load events past domComplete, I generally stop looking past this timestamp instead of using the full duration. For the most part, this is the best approximation to 'feeling fully loaded' that a page needs.
loadEventEnd
This is the end of the road for our navigation request. I personally don't find this timestamp nearly as useful as domComplete. Unless you are doing so much in your 'onLoad' event listener that it may affect performance (instantiation a canvas and the like), I don't believe you'll be putting too much emphasis on loadEventEnd. As an example, Amazon.com's loadEventEnd on my computer does not fire until almost 4 seconds from the start of a request, but it feels much shorter.
The list of metrics above is an important subset of all timing data that Navigation Timing API provides. If you are trying to find out how long a specific portion of the request took, such as DNS lookup time, check out the full Navigational Timing API Spec.
Using Navigation Timing
Starting any web performance discussion without baseline Nav Time API measurements is like treating a patient before asking about symptoms. But we can do much more with this data than simply measure our sites' performance. Here are some interesting additional use cases:
Performance Framework
Navigational Timing API can help us estimate performance costs and make better performance improvement decisions.
By providing a good framework around performance, your team can do a better job of prioritizing potential performance improvements and look after the lowest hanging fruits first. For example, the Nav Time API may tell you that your DNS lookup is taking a long time compared to your competitors, so you likely will gain significant performance improvements by switching to a faster DNS provider.
Use your performance data to create a performance hypothesis for adopting a new tool, make the adoption, then measure again to get a % performance gain in key metrics.
TroubleShoot
The Nav-Time API can be used to troubleshoot performance issues in the exact same environment as the user.
If a user is currently experiencing really slow page loads on their mobile phone in a rural area, it does not make sense to try and troubleshoot the issue with our MacBook pros sitting downtown. It's more efficient to give the user a programmatic way to report their performance and send the Nav-Time data along.
Automated Tools
Speaking of users sending performance data, you can use the nav-time API to come up with all sorts of automated performance analysis tools. Here are some ideas to get you started:
Measure your site's performance over time and make adjustments as usage pattern changes.
Set up an automated alarm and monitoring system when a particular user has exceeded some performance red-line, flag it, and deliver a more performant and lightweight version of the site/app.
Anonymize user performance data and use pattern recognition algorithms to detect clusters of performance bottlenecks that are otherwise hard to detect.
If you are anything like me, you love the warm feeling of watching cold hard performance numbers increase. And if you found this post helpful, you may also be interested in my post on how to prevent code review pushback or tips on better front-end documentation.
Happy Coding!
Resources and Additional Readings
 Ilya Grigorik